This is an old revision of the document!
Interactive map
This map of Africa demonstrates how you can use odd shaped buttons drawn as scalable vector graphics that can control and react to changes to properties in Blocks. The buttons shaped as countries of Africa will indicate its states, showing if a country is selected either from the UI itself or from any other logic that can happen in Blocks. The Display Spot will change its content depending on the selection done on the interactive map.
Installation
You need a computer with a running blocks server and a web browser to use this application note.
We have prepared a PIXILAB-blocks-root folder containing everything you need to run the examples. Download this ZIP file and unpack it.
If you don't know how to do this, read the instructions in the general setup section.
If you have done the general setup, copied the files and pointed to this application notes root block, follow the next steps to run this application on your computer.
- Start Blocks.
- Open the editor using the Admin button.
- Log in using the name admin and the password pixi.
- Open a second browser window and type in the URL: http://localhost:8080/spot/ this is where you will see some content controlled by the interactive map.
- Open a third browser window and type in the URL: http://localhost:8080/spot/index.ftl?mobile=Mob1, this is where you will control the map.
Run the example
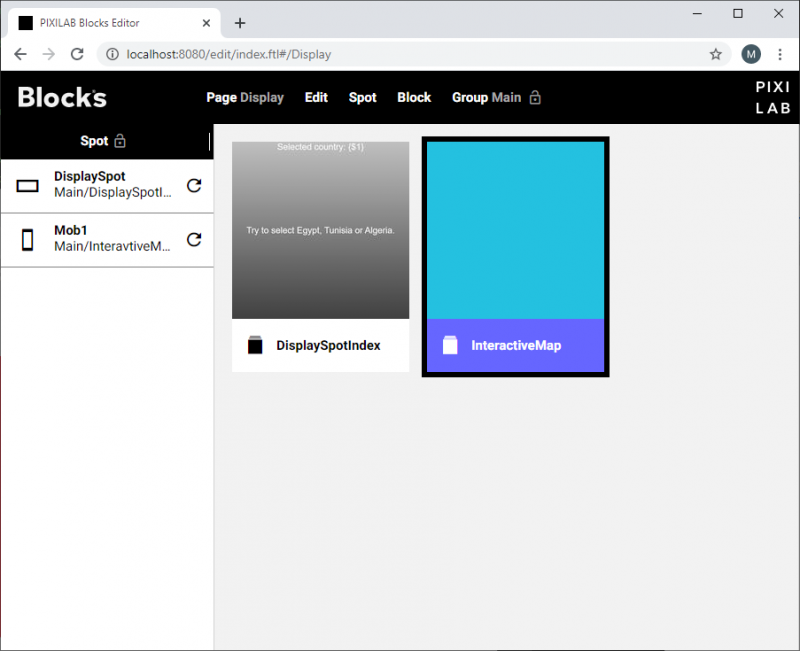
Assign the Interactive map to the Visitor spot and the DisplaySpotIndex file to the display spot.
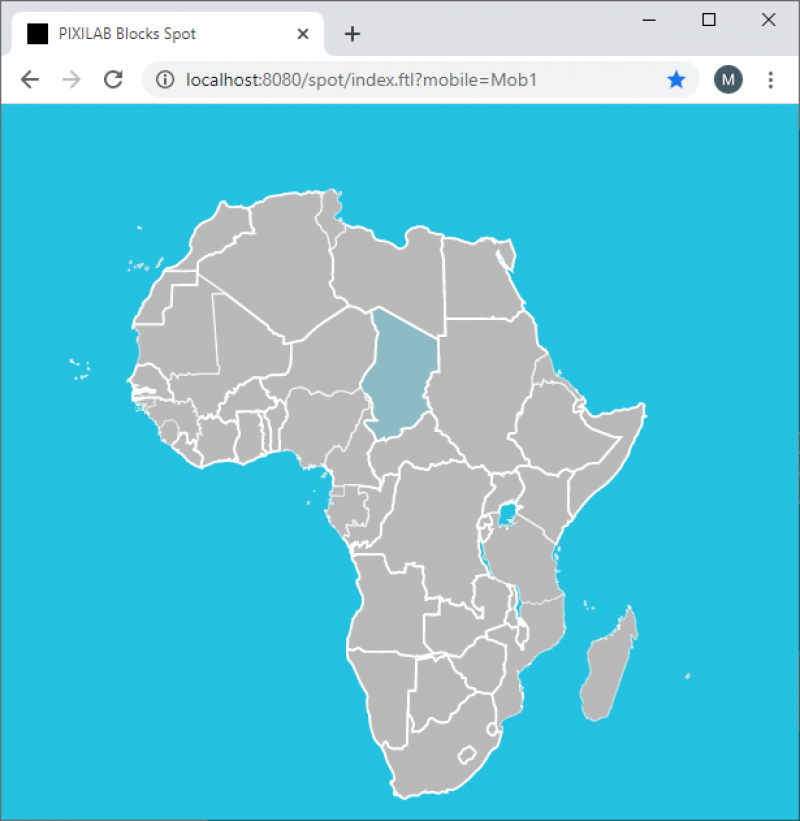
On the visitor spot you should see a map:
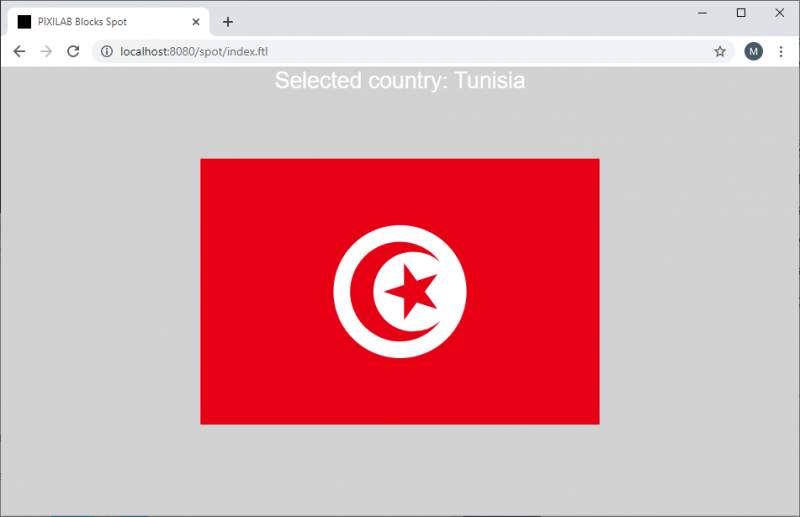
Go ahead and click on Tunisia you should see this on the display sport:
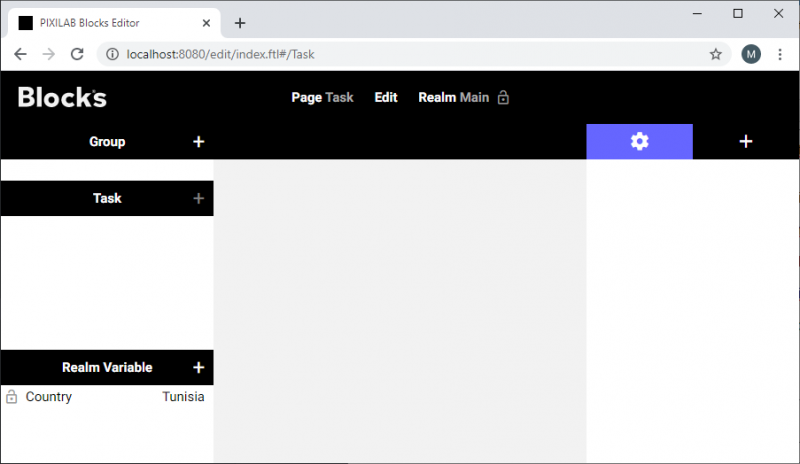
Open the Task page in Blocks editor to see the variable change according to the selection made on the map.
How does this work?
The interactive map itself is a custom web page that is stored under /public/html/SVGMap. In blocks this is displayed with a web block.

The web page is made up from a html file index.html. containing the svg paths and some styling.
There is also a javascript that is run from the index.html file. main.js that handles the particular logic from this example and the pub-sub-peer.js that provides a API that communicates with Blocks,
If we look at the index.html file in more detail, there is a typical set of general tags like the
<html><head><body>
Graphics
The graphis itself is stored inline as a svg element. where every country has a element ID named as the country represented. Some countrys are complex and is made up from a group of paths.
<path id="Algeria" class="land dz" d="M95.3138,56.0625 L95.6198,49.5394"</path>
The styling is declared inline inside the svg element tag.
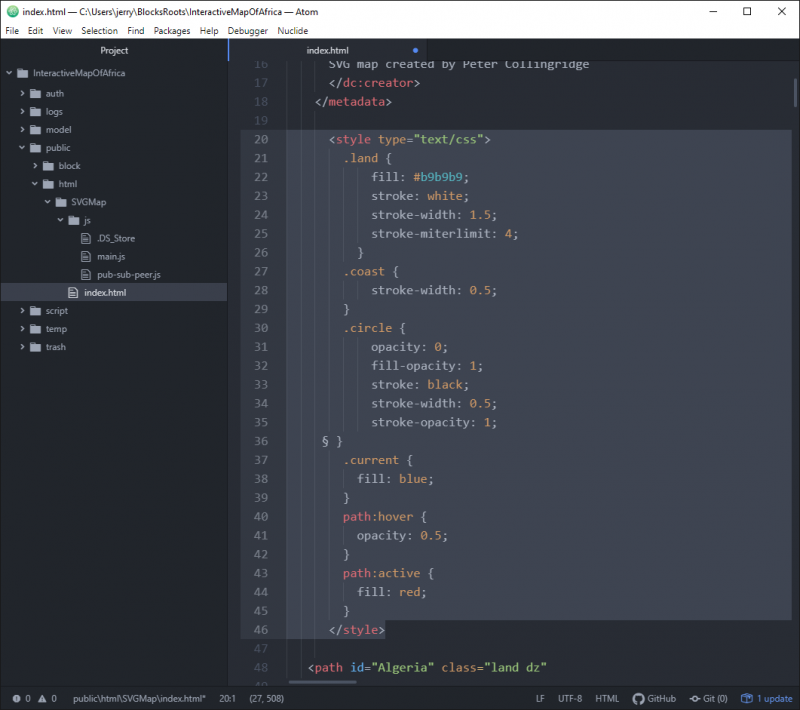
As you can see there are styles for things like path:hover and path:active. This is the styles applied when hovering over the element with the cursor and when clicking on an element. There are also styles for things like .land and .coast. The one that we use to indicate the currently active county in blocks is .current. This one is what sets the country to blue when it is currently set in the Country variable in Blocks.